Games as graphs (and charts!)
The visual display of quantitative information is much more fun than it sounds
3) Understanding the Economy
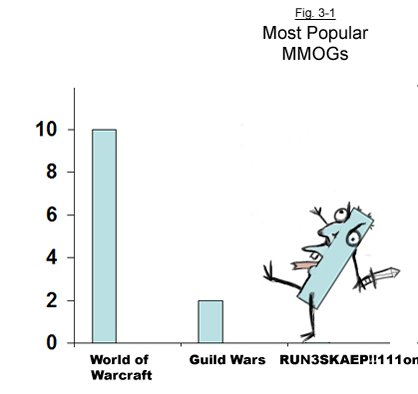
Figure 3-1. Most popular MMOs
Before recently, your choice of MMO was very limited. Today, hundreds of strains of massively successful Bacterium Onlinius have infested the internet – all mutated from a small number of primitive ancestors. Several have proven deadly, and most are at least capable of hijacking the human brain stem.
To give you an idea of today’s MMO landscape, we created figure 3-1, which compares the subscriber counts of three of the most popular MMOs.

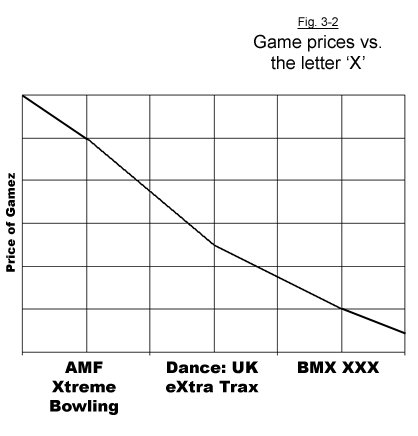
Figure 3-2. Budget Games
If you’re really strapped for cash, note the correlation between game prices and the number of unnecessarily prominent ‘X’s. Also note that the trend equally represents game quality.

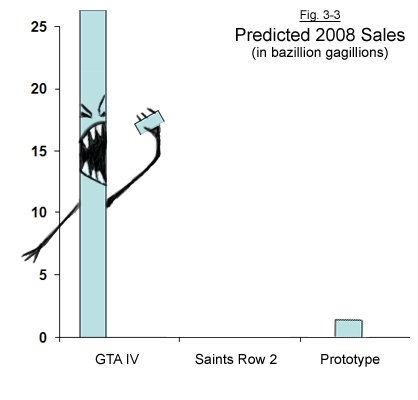
Figure 3-3. Understanding competition
Weekly digests, tales from the communities you love, and more
The games industry is highly competitive - everyone is grasping for a share in the marketplace, clawing over each other like rabid house cats – or some other such clawed creature.
If a developer is lucky, it can establish absolute dominance over its arena, as depicted in our final chart.

Apr 30, 2008


